Net Promoter Score Analysis for Carmax

I. Background
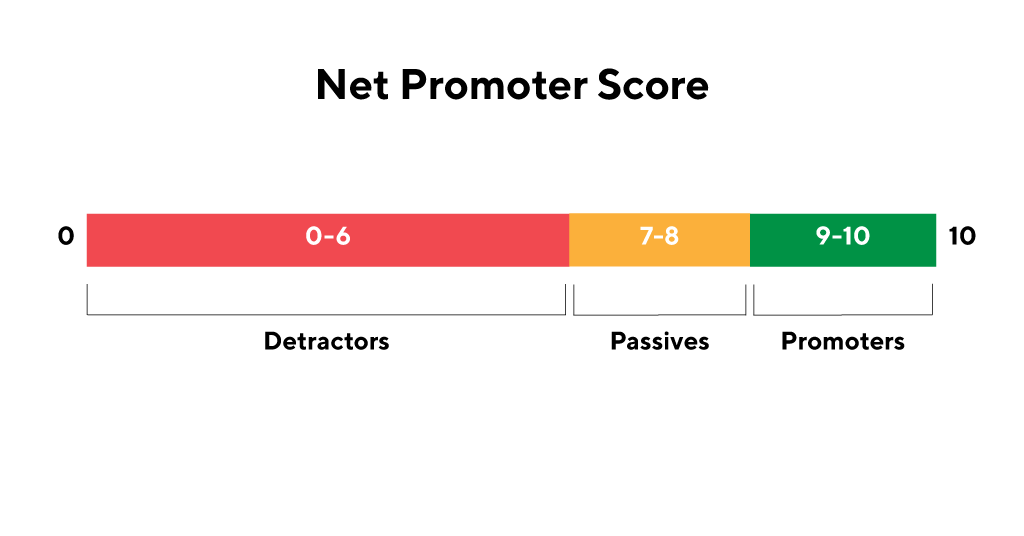
Net Promoter Score (NPS) is a widely used metric that is leveraged in customer experience programs to aid companies in improving their products and services. NPS measures customer perception based on how likely it is that they would recommend a product or service to someone they know, where respondents give a rating between 0 (not at all likely) and 10 (extremely likely).
The data set we chose was derived by CarMax, a used vehicle retailer based in the United States, which includes survey results from customers and information about their customer service experience. CarMax offers services very similar to that of businesses like AutoNation, Penske Automotive Group, and Carvana and, as a result, faces considerable competition in the market. We would like to shape our study questions around which explanatory variables have the greatest impact with respect to NPS, our outcome variable.
For example, does the inventory level of a given CarMax location (i.e. high, medium, low) increase or decrease NPS? Furthermore, is there a statistically significant relationship between the type and direction of first contact with a customer (i.e., inbound/outbound, text/email/call) and NPS? We believe these questions are important to evaluate in order to identify areas where CarMax can maximize operational efficiency.
II. Data
The data is a sample of 100,000 NPS survey results from customers who recently purchased a car from CarMax. Each row or record represents one survey response.
III. Data Analysis Plan
As part of our preliminary data analysis, we began by cleansing the data set. We first read in our csv file, converted categorical data to factors, and checked for missing values, at which point we discovered a high percentage of missing data for several variables. Below are the methods we used in R to correct this missingness:
• Use the select function to select only those columns in the data set which have less than 40% missing values • Use the preProcess function to impute missing values for numerical variables with the median • Use the na.omit function to remove any remaining missing values • Use the duplicated function to check for and remove any duplicate values
The new dimensions of our data set after completing these steps are 36,447 observations of 26 variables. We then used the summary function to examine the data set’s descriptive statistics to ensure that our data was properly cleansed:

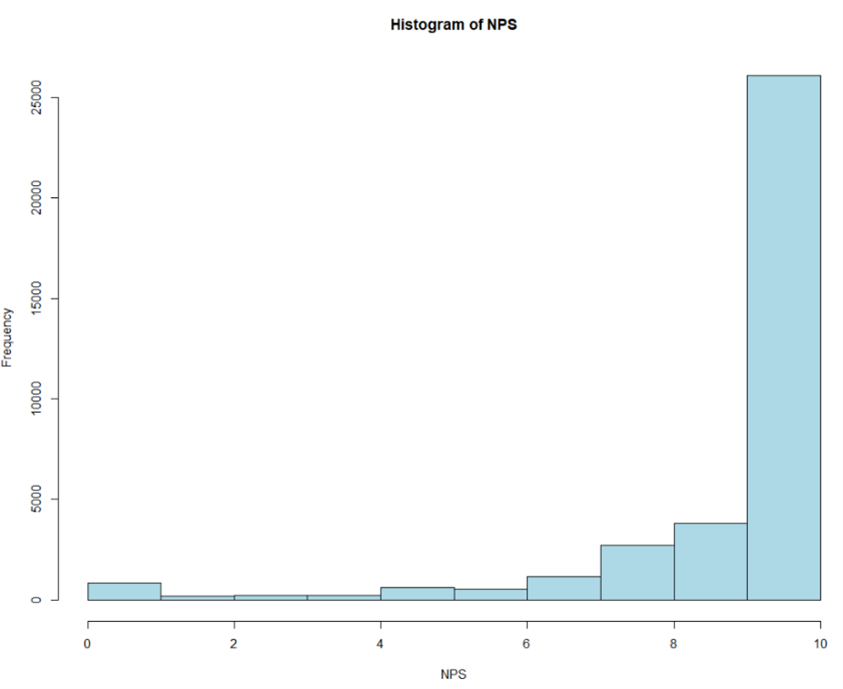
→ We can see below that CarMax’s Net Promoter score is negatively skewed** **because of some low ratings. However, CarMax’s mean Net Promoter Score is 9.15, which is relatively high.

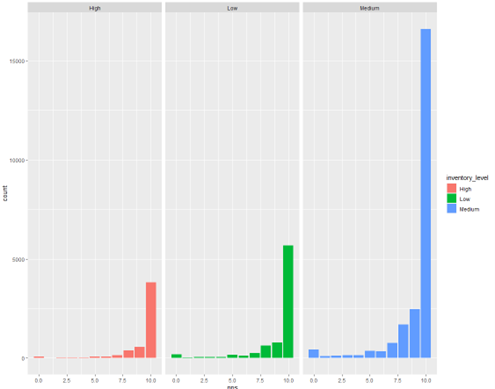
We can also see below that CarMax locations maintaining a medium inventory level have the highest frequency for attaining a Net Promoter Score of 10.

While these statistics and visualizations offer us some insights, we would like to determine what explanatory variables directly contribute to a high Net Promoter Score.We believe that linear regression would be a useful method in answering our study questions. Linear regression will allow us to study the linear relationship between a numerical dependent variable (𝑦 = NPS) and one, or more, numerical or categorical independent variable(s). We are specifically looking for those explanatory variables that result in a p-value of less than alpha = 0.05. With 95% confidence, we can then conclude whether there is statistically significant relationship between explanatory variables like inventory level and type of first contact with a customer and NPS. To determine whether the model is a good fit, we would refer to the Adjusted R-squared measure to evaluate how well the model fits the given data and explains variation – the closer to 1, the better. In the instance where there is a nonlinear and complex relationship between the outcome variable and explanatory variables, then decision trees may outperform a linear regression model. A decision tree will allow us to learn the relationship between observations in a training set, represented as feature vectors x (explanatory variables) and outcome variable y, by transforming training data into leaf nodes. Because the outcome variable we chose is numerical, we would opt to use regression trees. In this case, to determine whether the model is a good fit, we would refer to the Root Mean Square Error (RSME). The smaller RMSE of a model, the less mistakes in prediction tasks, which ultimately yields a more reliable model.
However, after conducting linear regression for this dataset, we found out this method may not be effective for a dataset that has a lot of high NPS score (those scores can be biased and not correct because of external reasons like
Survey quality - Customer who answer the survey frequently just for the sweepstakes and will rush through the survey without reflecting their reflections
Misalignment - high NPS score but giving low scores on other dimensions
The proportion of customer giving high NPS score achieves highest frequency
Because of the last reason, we decided to label who gaves a score higher than 9 is positive (1) while the people who label NPS below 9 is negative (0) and apply the logistic regression instead of the linear regression.
IV. Conclusion – Business Insight
Linear Regression is used to predict the correlation between NPS and other variables that lead to the rise of that score. Found a positive correlation between the level of inventory, type of first contact with a customer, outbound text: Outbound campaigns are when you send messages to an existing list, ave vehicle price band of 10k-20k, Credit rating: fair, poor but Logistic regression can be more suitable in some occasions depending on the business situation
Prior customer needs more customer services since they have a tendency to purchase again
Decision trees to be used to determine which vaccine is a good fit for a country
Strength and intricacies of governments’ infrastructure, healthcare systems, and technology are major factors in vaccinations progress
Buyers with credit rating like exceptional and very good need to be taken into consideration (or different marketing campaigns)
Buyers with credit rating like fair and poor needs more special marketing strategies
Inventory level of a given CarMax location
More information about the slides + code. Please visit my github.